


Before you start
- ✓ A CloudLinux-based server
- ✓ Access to cPanel
- ✓ The time the slowdown occurred
- ✓ Comparison with limits, not averages alone
Open CPU and Concurrent Connection Usage
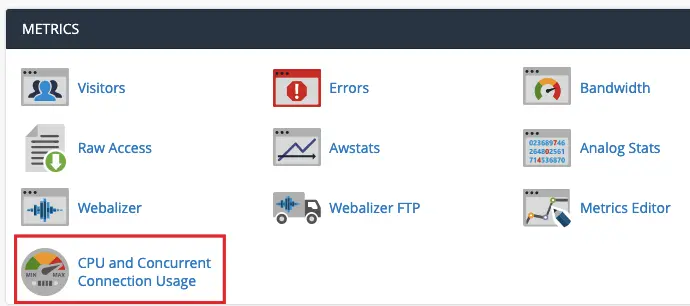
Under Metrics in cPanel, open CPU and Concurrent Connection Usage. This tool appears on enabled CloudLinux servers.
Read the Dashboard status
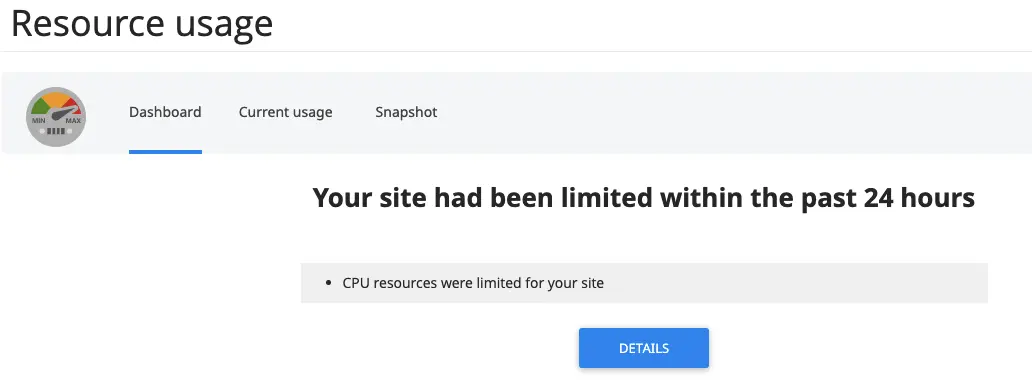
Dashboard states whether the site reached a limit within the last 24 hours and identifies the affected resource. Choose Details for deeper analysis.
Review charts for the correct period
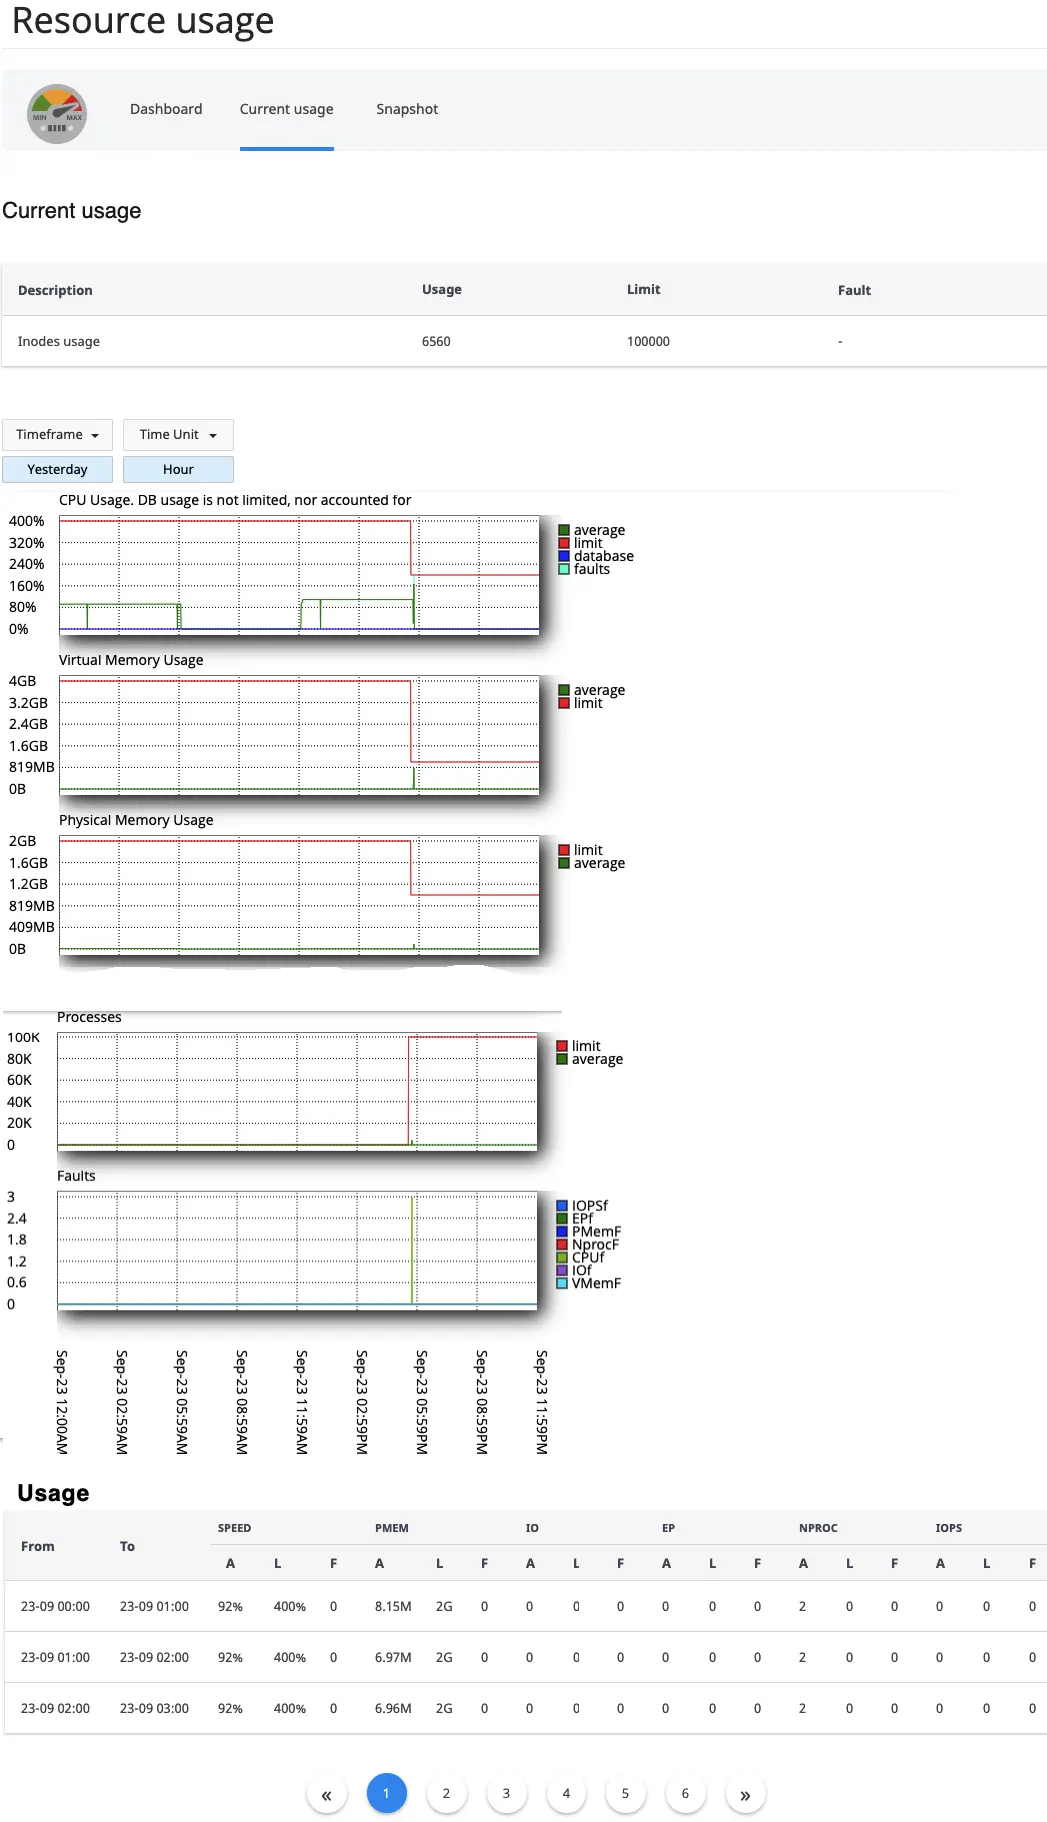
Open Current usage, set the Timeframe and Time Unit, compare green average lines with red limit lines, and inspect Faults.
Interpret Usage, Limit, and Fault
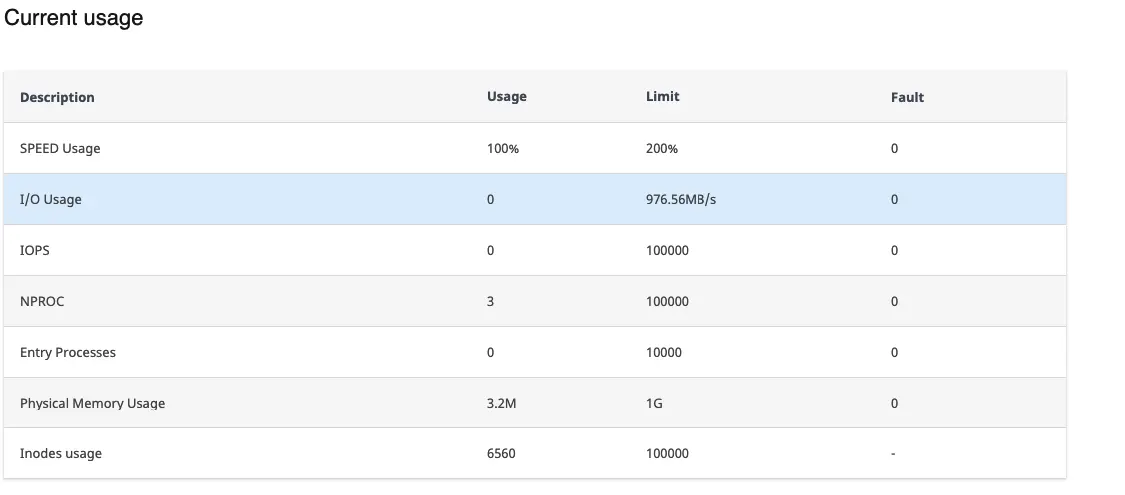
SPEED is CPU, PMEM is physical memory, I/O is transfer speed, IOPS is disk operations, EP is concurrent entry processes, NPROC is processes, and Inodes is file count.
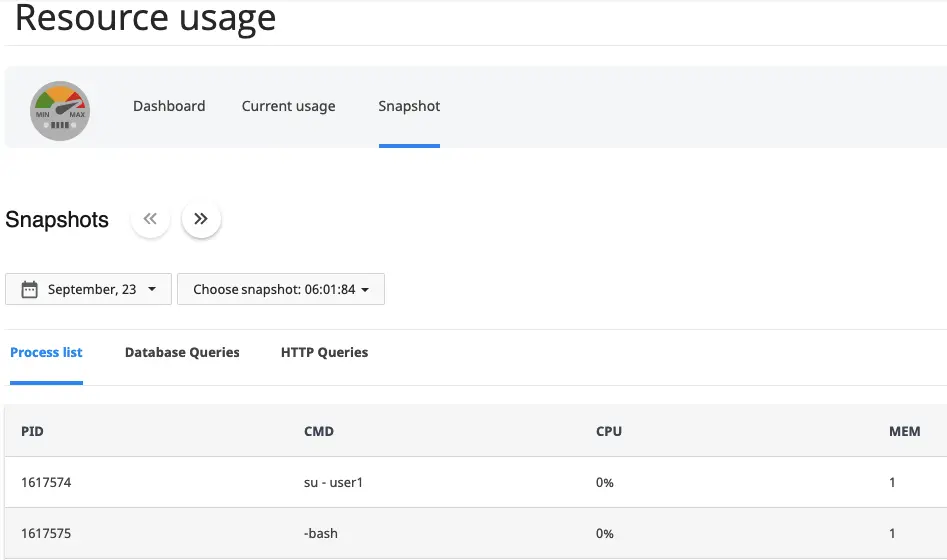
Use Snapshot to find the cause
Open Snapshot and select the incident date and time. Review Process list, Database Queries, and HTTP Queries to identify the process, query, or URL.
Important
A brief usage spike is not automatically a fault. Repeated Fault values at the same time as the slowdown are the stronger signal.
A brief usage spike is not automatically a fault. Repeated Fault values at the same time as the slowdown are the stronger signal.
You can now interpret resource usage
Match the fault time to a process or URL in Snapshot, optimize the cause, or contact ROT4 with the time and evidence.
Primary technical source: Official CloudLinux documentation
